Welcome to Tapas Forums!
.
Tapas Forums is an inclusive, worldwide community of diverse content creators and readers. It is amazing to see members connect with one another in this kind, supportive space we have cultivated together.
Our rules serve to provide and maintain a welcoming, healthy, and creator-friendly environment. These forum guidelines are meant to explain what is and isn’t allowed on Tapas Forums and to ensure that everyone has the freedom to express themselves within reason with as few restrictions as possible while maintaining a safe, inclusive environment conducive of creativity.
With 2022 now being upon us, a fresh set of Forum Guidelines have been implemented. These guidelines have been built on previous versions, with minor adjustments.
Forum Guidelines 2022
.
1. Respect Your Fellow Creators
Always be courteous to your fellow Tapas readers and creators. As a creative community, we are all here to share our love of creating stories. We have users from all over the world with different backgrounds, ideas, and preferences. While we may not always share the same points of view, we can still work to get along as a community.
- We will not tolerate hate speech, slurs, or harassment of any kind.
- Remarks that are offensive or targeted as direct insults to any individual, group, or genre are not allowed.
- Please do not use the forums to make rant threads about other creators or their works.
Don't forget that there is a real person behind every post, who, just like you, wants to be treated with respect and tolerance. As Tapas Forums aims to be a safe, welcoming environment that is nurturing of creativity, any behavior that threatens this culture will not be tolerated. This means preventing and moderating hateful behavior and harassment. We want all our users to have a comfortable experience.
If you come across a post that appears to be actively aggressive, displays hostile behavior, or breaks any of these rules, please flag it or contact one of the moderators listed at the bottom of this post so that it may be reviewed. Based on severity and type of violation, violators may receive a warning, temporary suspension, or indefinite suspension.
.
1.1 Community Safety
Despite the above rule being very straight forward, we recognise that other users can make you feel uncomfortable or unwelcome without using easily recognizable, hostile behavior. Being consistently disruptive, negative or argumentative can take the joy out of interacting with your friends and make it difficult to share your thoughts without fear of being targeted or your opinion undermined.
This kind of behavior can be difficult to moderate. There are no slurs, no direct confrontation, no active show of hostility. Without rules being clearly disregarded, warnings or suspensions are difficult to hand out.
Moving forward, we will review the behavior of individual users based on below standards when they are brought to our attention. The user -
- Receives a large number of flags over an extended time period
- Consistently creates posts that do not help the betterment of the community, i.e. posts are negative, disruptive, condescending, instead of creating posts that are supportive, creative, helpful
Users who consistently disrupt the community will be reviewed by all members of the forum moderation team. Should all forum moderators agree, the user will receive a temporary suspension of 90 days. Should the behavior continue upon return, the ban will become permanent.
.
2. Tag, Search and Quote are Your Friends
Before creating new topics, please check for existing topics with the same subjects to see if your question has been answered before. The “Questions” and “Answered” categories contain lots of useful information that may help you.
Be respectful to fellow readers and creators, who have already created similar topics and have generated ongoing discussions. A great way to jump into an active topic is to quote an existing post or to tag someone already active in the topic to engage them. We want to reduce multiple topics dealing with the same issues to make the forums easier to navigate for everyone.
However, we want to avoid bringing inactive topics back to life. If a subject you want to discuss has not been updated in the last 6+ months, feel free to create a new topic! Old zombie topics that were revived by accident can be flagged by the community and will be closed and/or unlisted.
In order to avoid the revival of old topics by accident as well as by spam accounts, we’ve implemented an automatic feature which closes topics automatically after 30 days of inactivity. This only affects new topics.
.
3. Do Not Solicit Sales on the Forums
Please refrain from trying to make any form of sales on our forums. This includes advertising commissions or editing services. Link dumping to a kickstarter or store front without contributing to the betterment of the forum will not be tolerated. If you want to link to your kickstarter, storefront, etc. then please make a topic that will help the community (whether it's things you've learned, or questions about how to improve).
.
4. Report Posts When Necessary
In the past, we've encountered a number of spam bots, which prompted us to adopt a two-step authentication system for flagging posts. If two users flag a post, then the post will be hidden until moderators can review it. Posts that go against our community guidelines may be kept hidden or removed at any time.
Beyond reporting, if you feel that a topic has escalated to a point where discussions are no longer healthy, please flag the topic to bring it to the moderators’ attention. Oftentimes, a moderator may close the topic for review. Afterwards, the moderators will send out warnings or follow ups with the involved parties and either re-open the topic or permanently close and unlist the topic with a closing statement regarding why the decision was made.
.
5. Categorize and title your topics appropriately
With so many topics being created daily, it's important for topic titles to be clear and concise to help readers and creators easily navigate the forums and find relevant topics. Always title your topic appropriately - clickbait or unclear titles may be revised without notice.
.
6. We want to celebrate your work on our platform!
We are excited about your accomplishments and the hard work you’ve put into your creations on Tapas! Since this forum is a space where Tapas creators can communicate with each other and the team, please focus on topics related to Tapas.io. Topics about other platforms may be closed and unlisted.
Please continue to share your work that is hosted on Tapas in any of the existing topics or megathreads that are made for that purpose or create new, exciting topics that allow the community to share their own work or creations they love. Please avoid creating topics that promote only one comic or novel to reduce spam. Old, outdated self-promotion topics may be closed periodically to make space for newer versions. We will be closing and unlisting those.
.
7. Collaborate like a champ!
Cain created a great set of guidelines for our Collaboration category. Before posting, please review this guide and make sure you add as much information as you can to your own topic. This ensures that potential creative partners have an easier time judging if they should work with you. We encourage you to put time and effort into your collaboration posts.
Topics that have insufficient content and don’t follow our guidelines will be closed and hidden by moderators.
.
8. Customer Service questions and technical support
In order to keep track of any technical concerns more efficiently, we have implemented a new workflow in 2021. This will allow your report to be forwarded to the appropriate teams, so it will be seen and heard. Please read more about how it works and who to contact here!
.
Please meet your forum moderator team!
.
@joannekwan - I’ve been a community creator on Tapas for over 5 years now and have been an active participant on the forums for nearly as long. As such, I hope to use my experience with the community to help out where I can. I’ve created many works, notably Demon House, Heavy Horns, and Secunda.
@Jenny-Toons - Hi everyone! The name's Jenny! Been on the forums and Tapas since late 2017, and I'll probably be around for a while longer! I'm one of the newer forum moderators, as well as the creator of Our Universe and My Demon Valentine.
@tapascommunityteam - This is our official moderator team account. It is used by all moderators.
@Ratique - I’ve been a long time community moderator and am the Director of Community at Tapas. I’m also the creator of the webcomic Queen of Gods.
@Victoria1 - I am a Community Marketing Coordinator at Tapas Media! It is always my goal to maintain a positive, supportive atmosphere where creativity can flourish. I truly enjoy seeing all the amazing comics and novels that you all have created, and I look forward to bringing engaging, exciting events for you all.
.
Thank you for reading and keeping these guidelines in mind when using our forums. As new situations arise, we find it necessary to modify or expand upon our forum guidelines. If you have any questions, concerns, or feedback, please reach out.
Thank you and happy posting!
Tapas Team

 Jun '20
 Jul '20


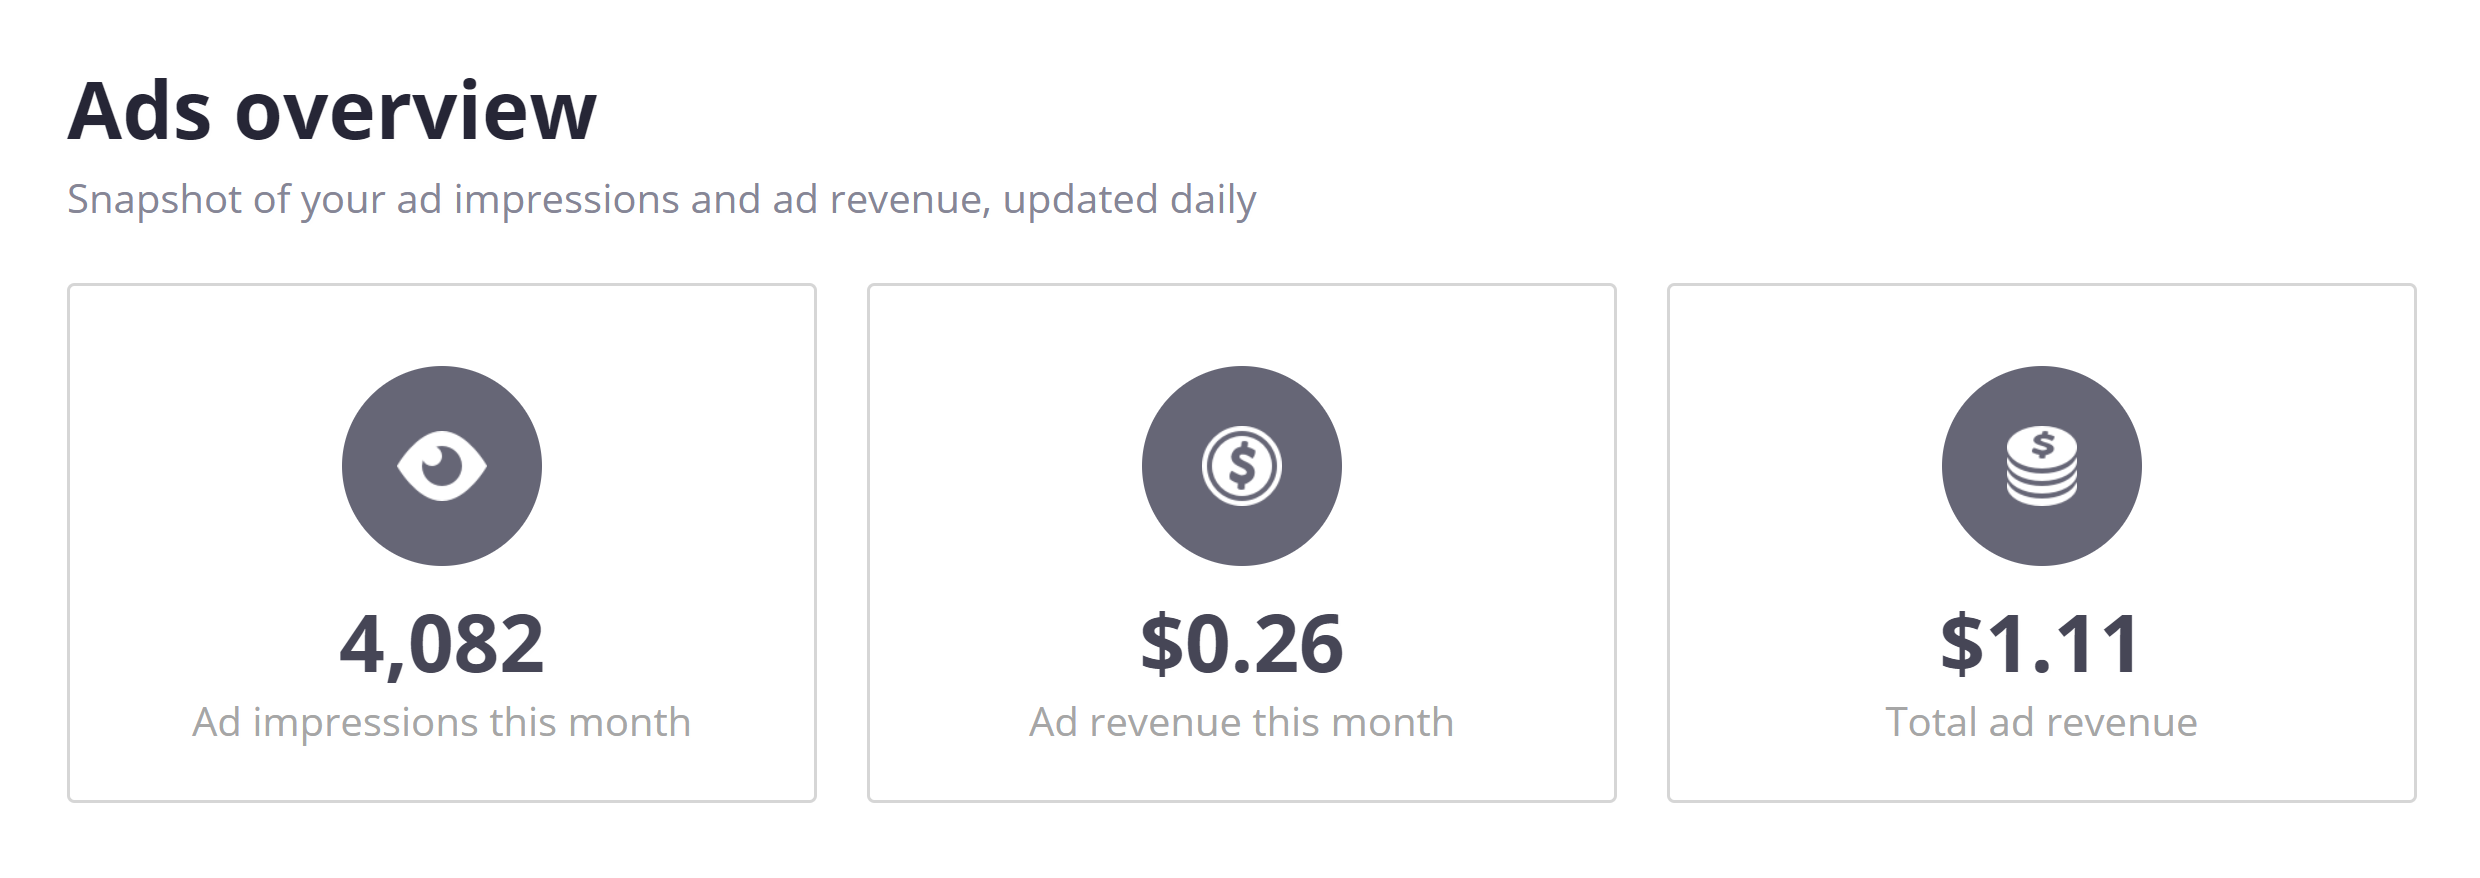
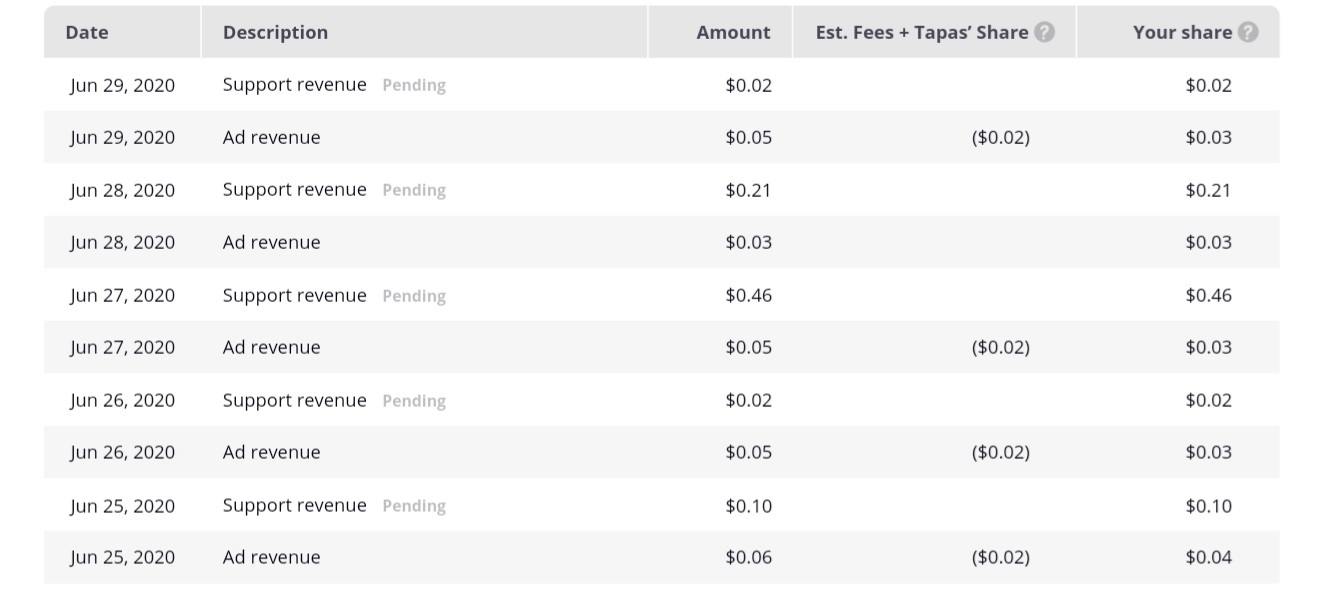
 One month, I got almost 1.4k impressions and $0. Last month, I got 1.8k and got $0.09. This month, I'm at 730 impressions and $0.01. So who knows?!